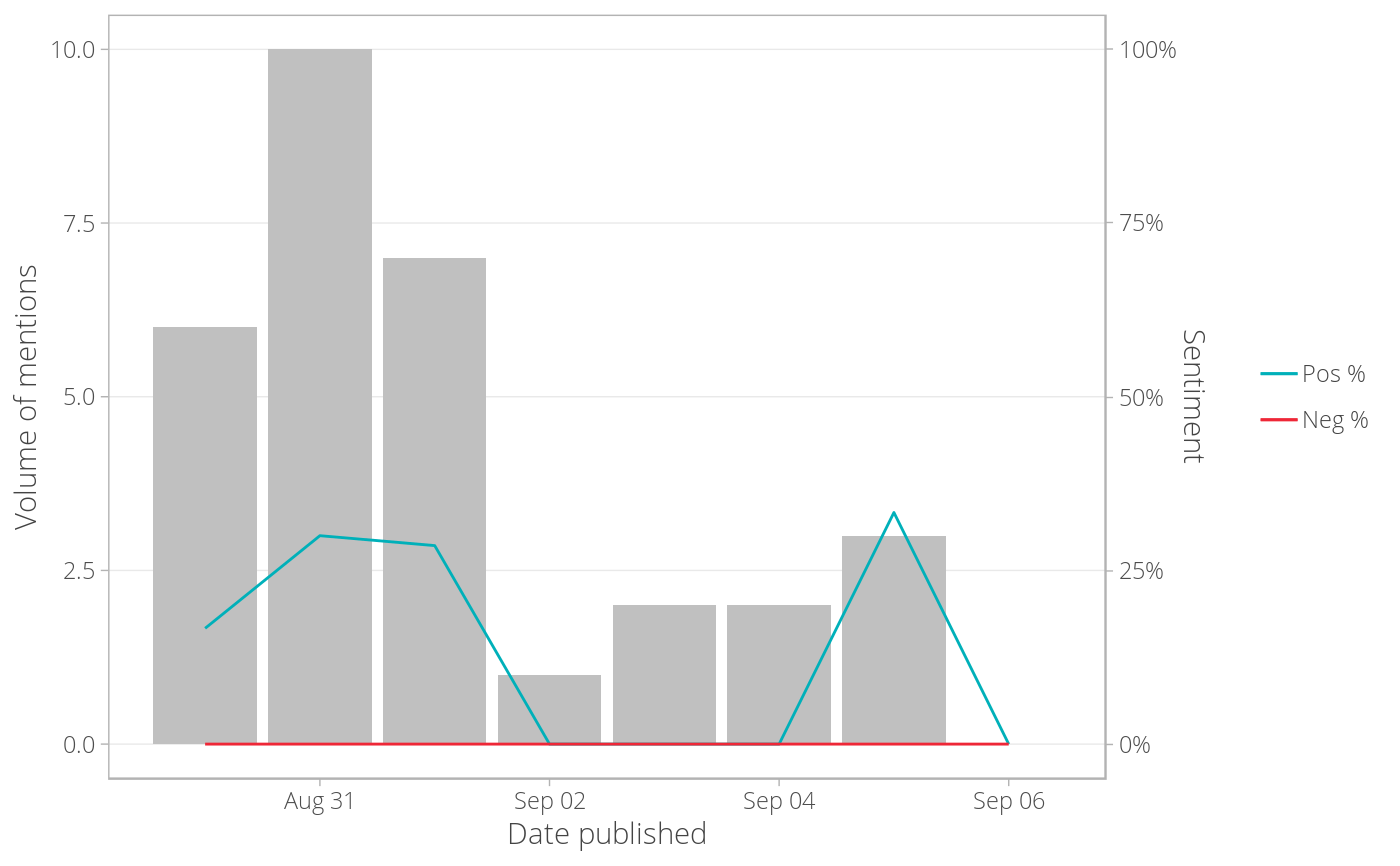
Plots volume overlayed with sentiment.
plot_volume_sentiment_metric.RdPlots volume overlayed with sentiment.
plot_volume_sentiment_metric(account, filter, group = "day")
Arguments
| account | An account code |
|---|---|
| filter | A filter for data |
| group | A string indicating how you want your data grouped |
Value
the ggplot object
Examples
plot_volume_sentiment_metric("QUIR01BA", "published inthelast week and brand isorchildof 10006")